PopMaps : Reliable Population Density Maps for Global Telecoms Planning
LuxCarta’s population density maps help you plan telecommunications infrastructure better.

Get a Reliable View of Population Density Anywhere on Earth
Right data. Right places. Right decisions.
Enable your network and marketing teams to deploy with precision—track current and projected population down to 10 m resolution using LuxCarta’s satellite-based PopMaps.

Optimize capital deployment
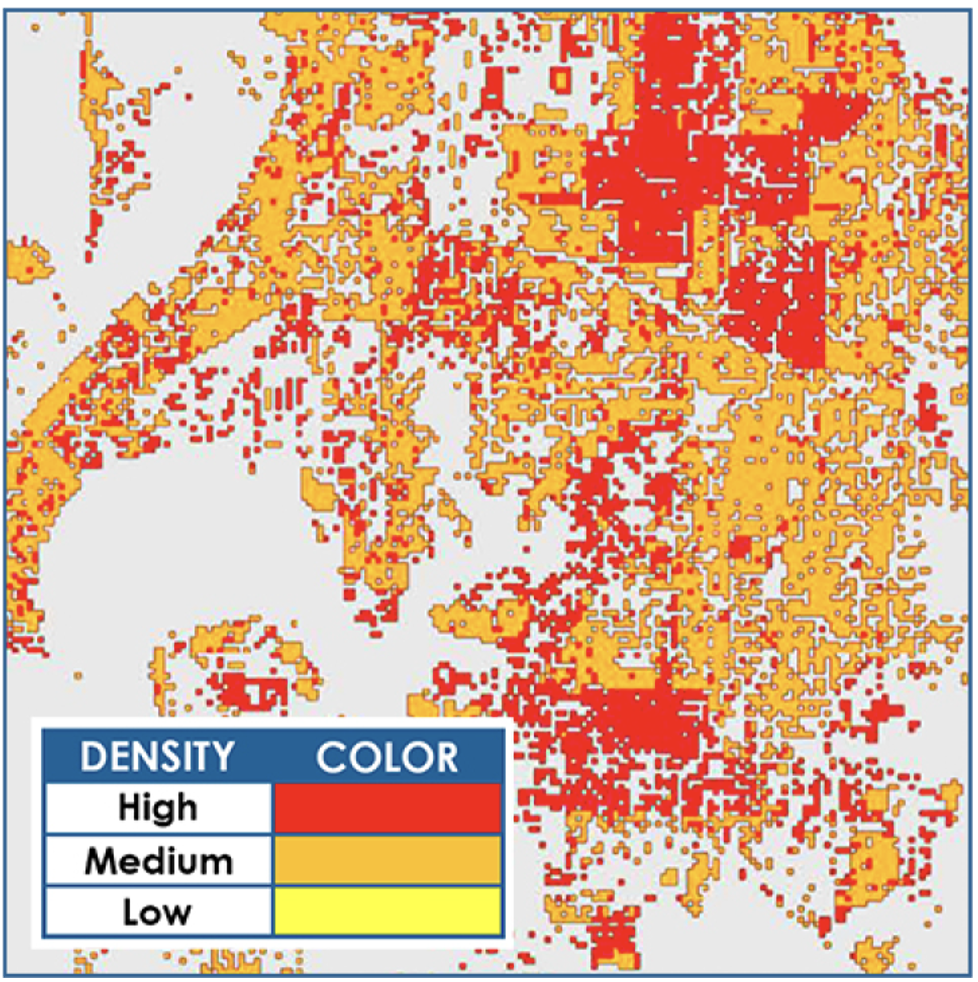
Install towers and radios only where people live—no waste in low‑density zones

Target emerging markets effectively
Wireless equiment is expensive. Our PopMaps mean you install the right amount of hardware, where it’s needed.

Reduce opex through smarter resource use
Efficient site visits, targeted rollout, and optimized team deployment reduce time and cost .

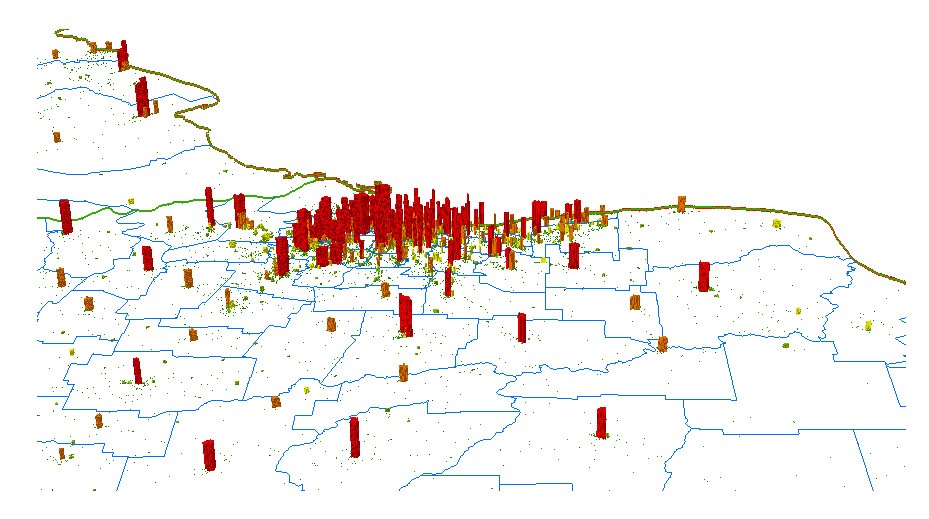
Bridge the digital divide
PopMaps enables operators to reach underserved rural and peri‑urban communities more efficiently . By precisely identifying these pockets of unconnected demand, telcos can prioritize infrastructure investment in areas with high impact—supporting inclusion and creating new revenue opportunities.
How PopMaps Works — LuxCarta’s Proven Process
For 25+ years, LuxCarta has specialized in precision geospatial data for telecom planning. PopMaps combines multiple data layers into an actionable, highly reliable view of real population distribution.
It starts with Satellite Imagery
In countries with reliable census data, we populate our density maps using the latest available figures. Our demographics experts extrapolate population trends forward if it has been several years since the last census.
For countries with no (or unreliable) census data, we use proprietary methods to estimate population density. This includes up-to-date satellite imagery of human settlements to estimate the number of people living there.
AI-Powered Feature Extraction
Using proprietary classification models, we accurately distinguish man-made features:
-
Dense Urban
-
Urban
-
Suburban
-
Villages
-
Commercial / Residential zones
Census Data Fusion & Projection
Combining population data and building characteristics, we produce a density raster map for each division in a city, suburb or rural area. The density map provides a clear, easy-to-understand representation of the number of people living in each neighborhood or administrative area.
Deliverables Optimized for Telecom
Your team receives easy-to-use, GIS-ready datasets compatible with RF planning tools like Atoll, Planet, Asset or your custom workflows:
-
Raster & vector formats
-
Country-wide or region-specific coverage
Benefits for Telecom Operators
Overcome key challenges to telecoms rollout and upgrade projects with a true view of population density in every market. LuxCarta’s population density maps mean you:

Expansion and Densification
Prioritize greenfield zones and define exact densification targets.
Geomarketing Empowerment
Sales & marketing can focus campaigns where potential and existing customers cluster.
Operational efficiency
Avoid redundant build-out and plan based on real human presence, not arbitrary tiles.
Integrate your Population Density Map With All Planning Technology
List of Integrations: Information on software, tools, and services that the product integrates with, enhancing its utility and flexibility.
Integration Details: Brief explanations of how each integration adds value to the user experience.
Testimonials and Case Studies
Learn how global telecommunications firms are benefiting from LuxCarta’s unique population density map solution.
“We needed a way to show our senior leadership team that marketing was producing results, and that’s hard when your metrics are scattered. This dashboard saved the day.”
Frequently Asked Questions
We’ve answered common questions about our population density map solution.
What is a population density map?
A population density map is a map which represents the number of people living in a unit of land area. PopMaps use different methods to show how many people live in a selected area, but typically employ color (e.g., red for many people, green for fewer people, yellow for almost no people). Density maps can be generated at any scale, depending on your needs. It’s common to show population by square kilometer, or administrative boundaries (such as zip/postal codes).
How long does it take to produce a population density map?
It depends on the area of land to be included in the map, and the resolution required. At LuxCarta, our highly experienced analysts can produce population density maps for an entrie country in as little as 4 - 5 weeks.
Why do telecom firms need population density maps?
PopMaps provide several key advantages to telecommunications companies. When planning out or upgrading a network, you need to have a good idea of the market size in a destination - population density maps provide invaluable market insights. They are also extremely helpful when planning locations for base stations and cell towers - you need to be sure infrastructure will reach the highest number of customers. And they serve as dynamic tools for capacity management - allowing telecom providers to proactively balance loads based on real-time population patterns.