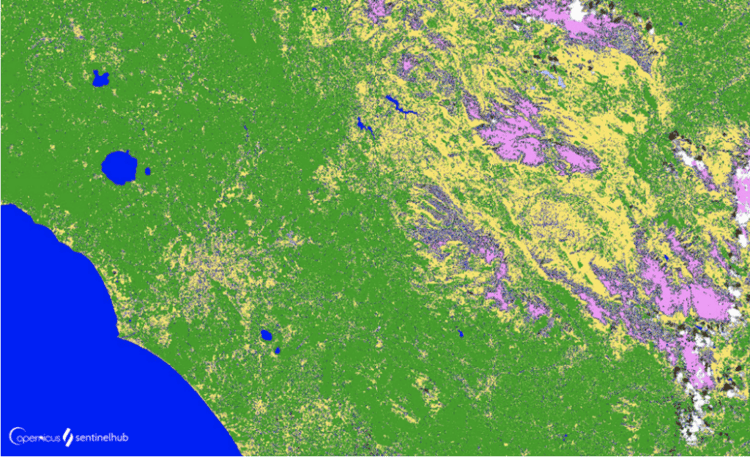
Land use classification plays a key role in urban planning, resource management, and environmental monitoring. Previously dependent on manual surveys and aerial imagery, the advent of Earth observation technologies, remote sensing, and Geographic Information Systems (GIS) has significantly changed our methods of land use classification. In this post, we will start a “supervised” classification utilizing Sentinel-2 satellite imagery with a 10-meter resolution, and we will concentrate on the specifics of the procedure, including categories, legends, and additional details. This semi-automatic method takes advantage of open data (Copernicus program) and Earth observation to provide a perspective view.
The Sentinel-2 Satellite and Open Data
Availability of Sentinel images is the key source of the Copernicus program, a significant advancement in Earth observation. Its multispectral sensor takes images in different spectral bands, providing a sharper view of the Earth’s surface. The adoption of open data stands for transparency and makes this important information widely available, benefiting researchers, planners, and the public. This abundance of open data has expanded the possibilities for land use classification.
Earth Observation and Remote Sensing Techniques
Earth observation and remote sensing are fundamental for classifying land use, enabling the collection of terrestrial and atmospheric data without being on-site. Sentinel-2 offers a broad spectrum of data, capturing both visible and non-visible light, allowing the identification of key land features like vegetation, water bodies, and urban areas, crucial for the classification task.
Earth Observation is the practice of collecting data about our planet through satellites and sensors. The Earth Observation Browser is an online tool that facilitates access to a vast array of Earth observation data and imagery. It allows for the exploration and analysis of important environmental data, supporting diverse applications such as disaster response, environmental stewardship, and scientific investigation.
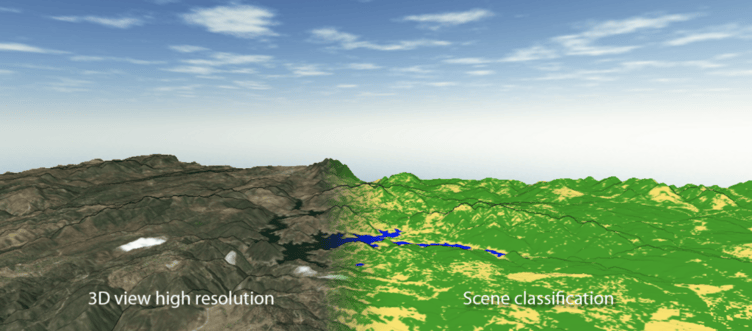
Scene classification was developed to distinguish between cloudy pixels, clear pixels, and water pixels of Sentinel-2 data and is a result of ESA’s Scene classification algorithm. Twelve different classifications are provided including classes of clouds, vegetation, soils/desert, water, and snow. It does not constitute a land cover classification map in a strict sense but it helps us to understand the steps we take to state the area we are classifying is in fact what we guess it is. The closer we are to ground truth, the more accurate the classification will be.
Typologies in Land Use Classification
Land use classification involves the categorization of land into distinct types based on its primary function or purpose. This classification plays a pivotal role in urban planning, resource management, and environmental assessment. Common typologies include residential areas, industrial zones, agricultural lands, water bodies, forests, and more.
The typologies are refined to fit specific project needs, allowing for precise assessment and decision-making. In the realm of land use classification, an array of menus and parameters come into play during image processing. The menus facilitate the selection of spectral bands that are most relevant to the classification objectives. Parameters are carefully chosen to calibrate the imagery for analysis. This precision is essential to ensure that the processed images reflect the true nature of the land surface, allowing for accurate classification.
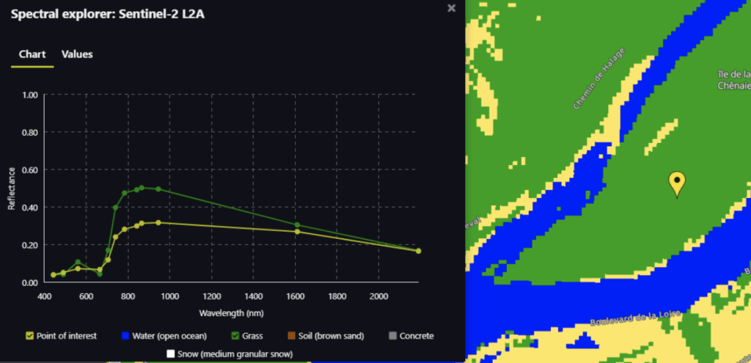
Spectral signatures show the variation of the radiation reflected by objects as a function of wavelength. This physical behavior is considered in multispectral analyses to recognize certain elements in the images.
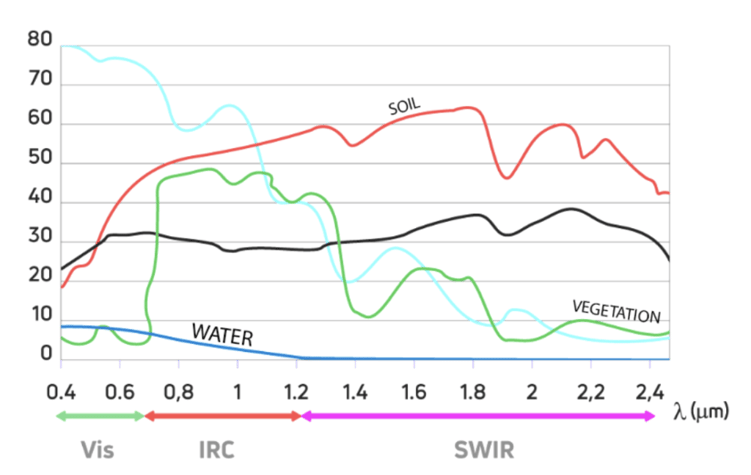
Now let’s look at three different types of land use, water, soil, and vegetation.
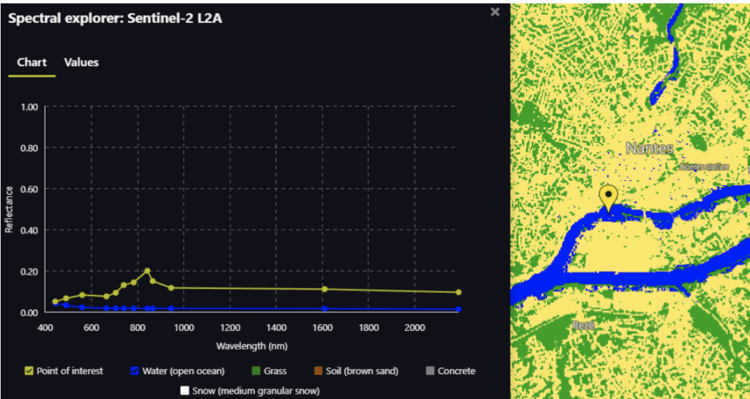
Example of extracting/classifying WATER
Not all pixels in which we find water will have the same spectral signature, but it will look similar to this one. This type of surface has an inverse signature to that of the ground, since the highest reflectivity of water is in the visible bands, reducing towards the near-infrared.
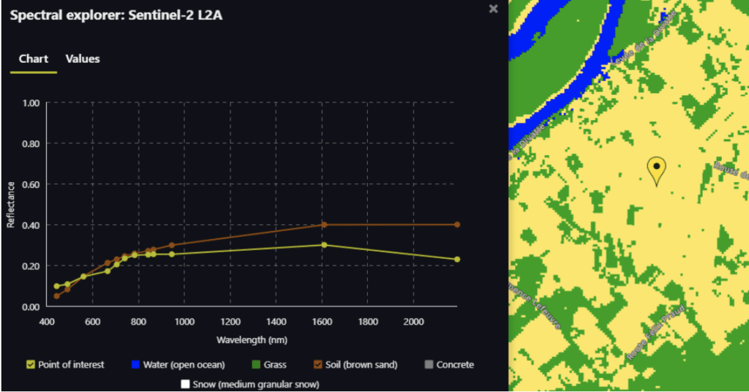
Example of extracting/classifying SOIL
The spectral signature of the soil is more complicated because it is influenced by its structure, texture, moisture content, and composition of it. This signature is quite flat and ascending in shape.
Example of extracting/classifying VEGETATION
Healthy vegetation shows low values in the visible spectrum and its highest reflectivity is in the near-infrared due to low energy absorption. It is lower in the mid-infrared due to the absorbing effect of water on the leaves.
If we look at this signature obtained from a Sentinel 2 image, we can see that there is greater reflectivity corresponding to the near-infrared (0,7-1,2 nm). This decreases into the mid-infrared.
Maybe in a later post, we will describe in more detail the spectral signatures of other classes such as clouds or cement, but let’s leave it there for the moment to understand it little by little. Let us now start with the symbolization of these classes.
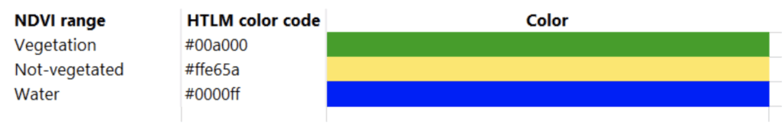
Legends and Data Visualization
Legends are a critical component of land use classification. They provide an essential reference for understanding the output of the classification process. Legends describe the categories into which land is classified, allowing users to interpret the data. By associating color or symbol representations with specific land types, legends make it easier to visualize and communicate the results, ensuring that stakeholders can make informed decisions.
Because maps are representations of the real world, cartographers will use symbols and colors to tell the reader what they are mapping.
And finally, integration with other GIS layers
Geographic Information Systems (GIS) are the backbone of land use classification. GIS software facilitates the manipulation, analysis, and visualization of data, enabling the transformation of raw satellite imagery into meaningful information. The overlay of various data layers allows for the creation of land use maps, integrating geographical information to inform urban development, agriculture, forestry, and environmental management.
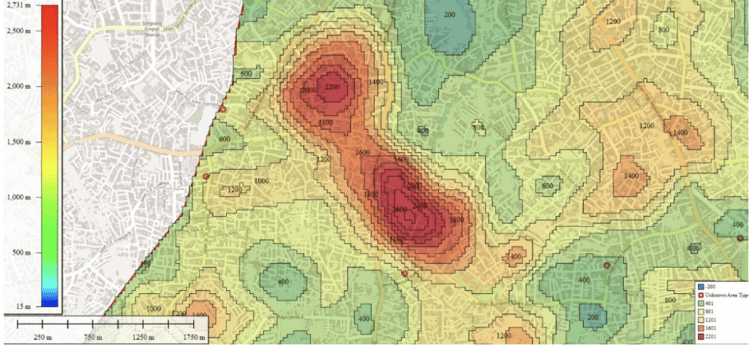
This is for example the case of population/Density Maps, indispensable for telecom companies. They inform strategies for network planning, optimization, and geomarketing, helping businesses make data-driven decisions. Although conventional mapping techniques have limitations, particularly in emerging markets, Luxcarta is bridging this gap with more reliable, up-to-date information.
In the telecom context, a population density map isn’t just about counting heads; it’s about understanding where potential customers are. These visual representations display the number of people living per unit area, thereby offering insights into where network demand could be highest or where untapped markets may exist.
Leveraging Data to Optimize Networks and Unlock Market Potential
Understanding the geographical distribution of populations is crucial for telecom companies engaged in network planning, optimization, and geomarketing. Population density maps are not merely academic tools; they are actionable assets that guide decision-making processes in these fields. This blog post will explore how these maps can be an invaluable resource for telecom businesses.
But before ending this post, let’s clarify this term: Open Data. Is it data for free? No, it’s not. What can a private company like LuxCarta offer their customers while merging Open Data and private expertise?
- Leveraging open data can significantly enhance a company’s value proposition by combining freely available information with unique expertise.
- Integrating open data with proprietary datasets enriches the overall dataset, revealing previously undiscovered correlations.
- Transforming raw data into actionable insights distinguishes a company’s capacity to provide valuable intelligence.
- Contributing to the open data ecosystem through data quality enhancements establishes the company as a reliable source of information within the industry. In summary, a company’s value addition to open data lies in its ability to fuse information with industry expertise, proprietary datasets, advanced analytics, and a commitment to data integrity, positioning it at the forefront of innovation and decision-making)
In conclusion, the integration of Sentinel-2 imagery with open data, remote sensing, GIS, is driving the evolution of land use classification. This approach offers a first-hand understanding of the Earth’s dynamic surface. Technology, data, and expertise synergize to revolutionize land use perception and management, offering valuable insights for sustainable development, resource management, and environmental conservation. Researchers, policymakers, and Earth observation technologies continually expand the journey of land use classification, with our interest guiding them.
